leonardo digital twin
As we move into the exascale era, supercomputers grow larger, denser, more heterogeneous, and ever more complex.
Operating such machines reliably and efficiently requires deep insight into the operational parameters of the machine itself as well as its supporting infrastructure.
To fulfill this need and in order to allow the continuous monitoring, archiving, and analysis of near real-time performance data from the machine and infrastructure levels from both the maintainers and users points of view, we have worked in collaboration with the University of Bologna to implement an Operational Data Analytics Infrastructure, testing it on current Cineca’s supercomputers such as Marconi 100.
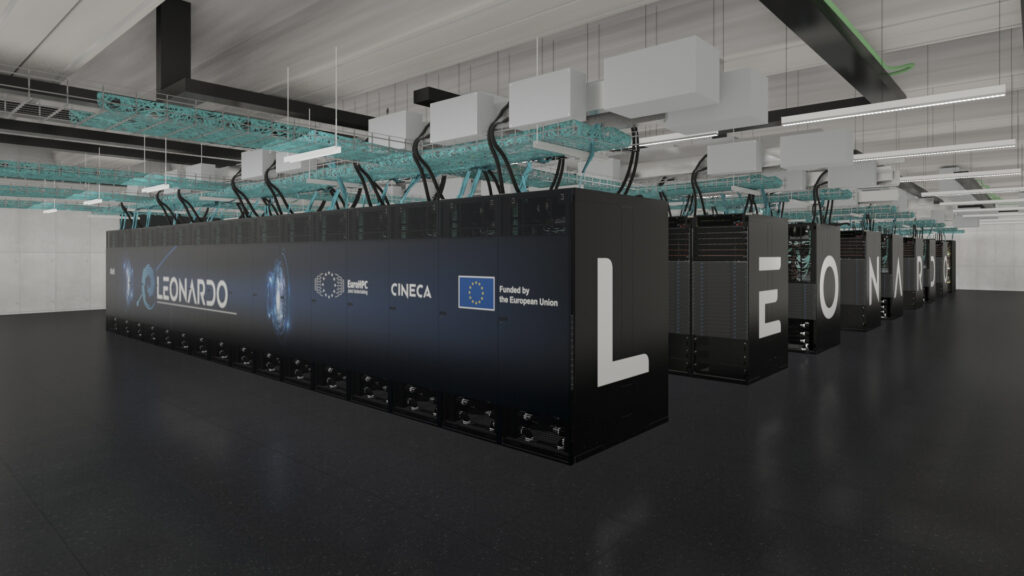
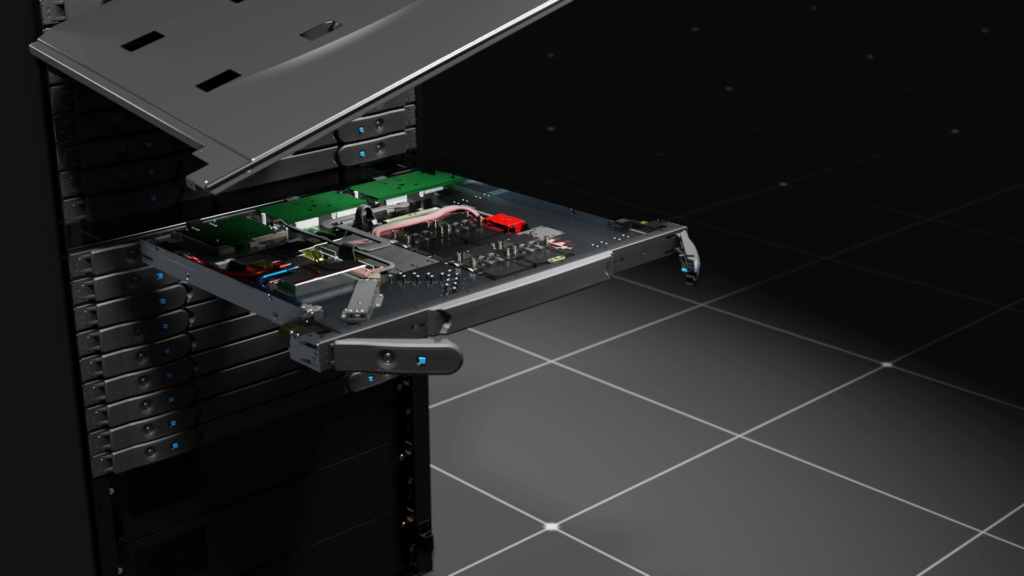
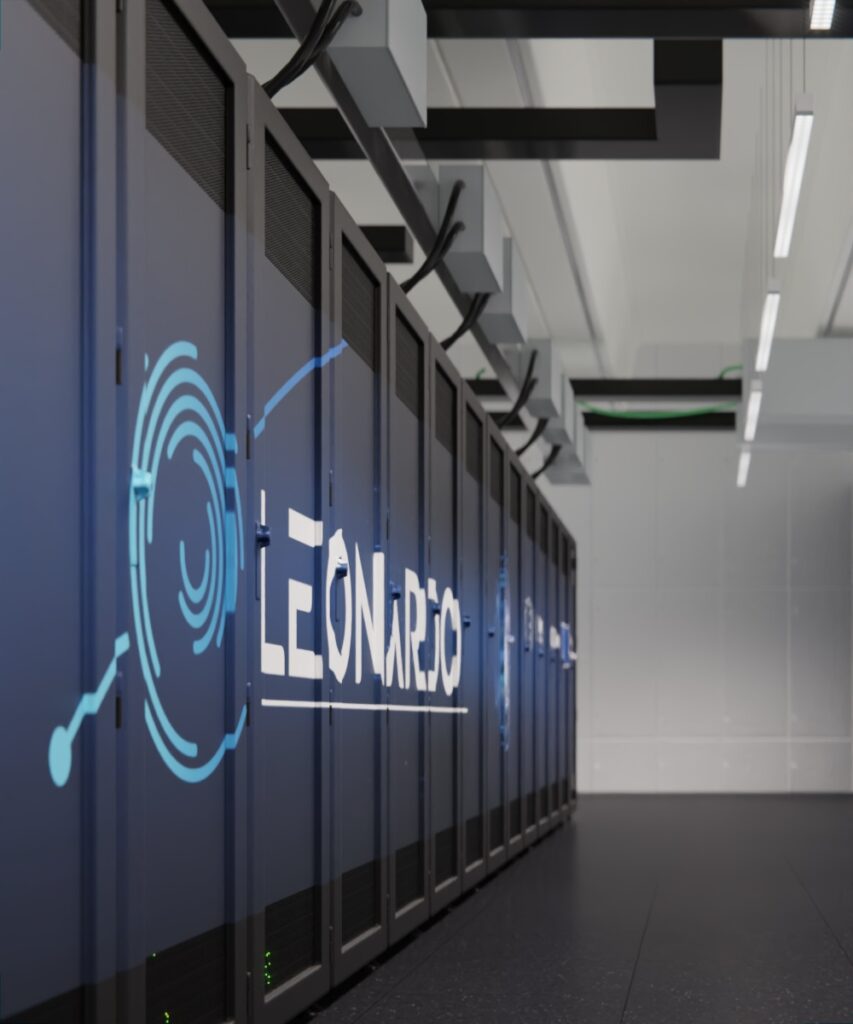
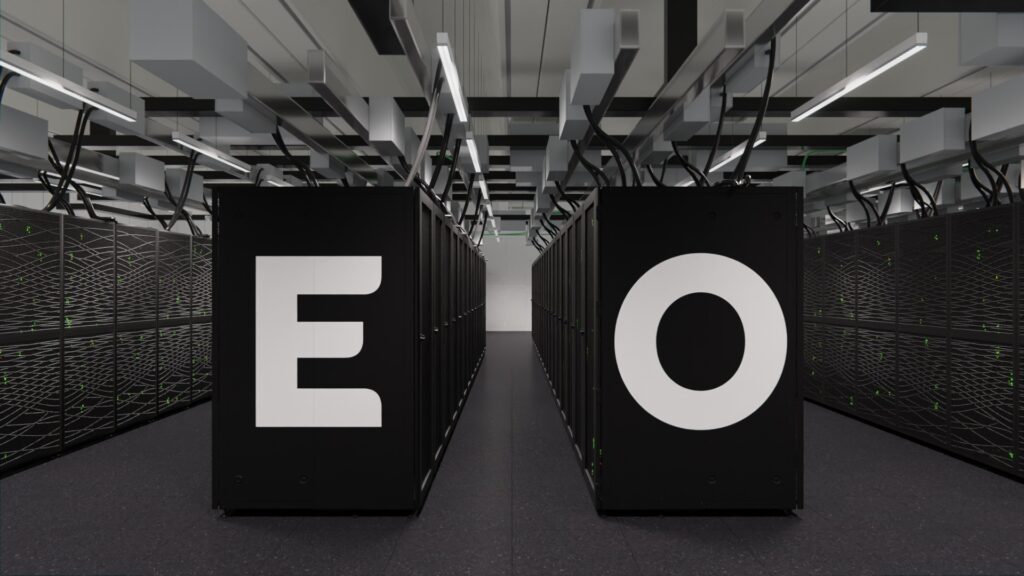
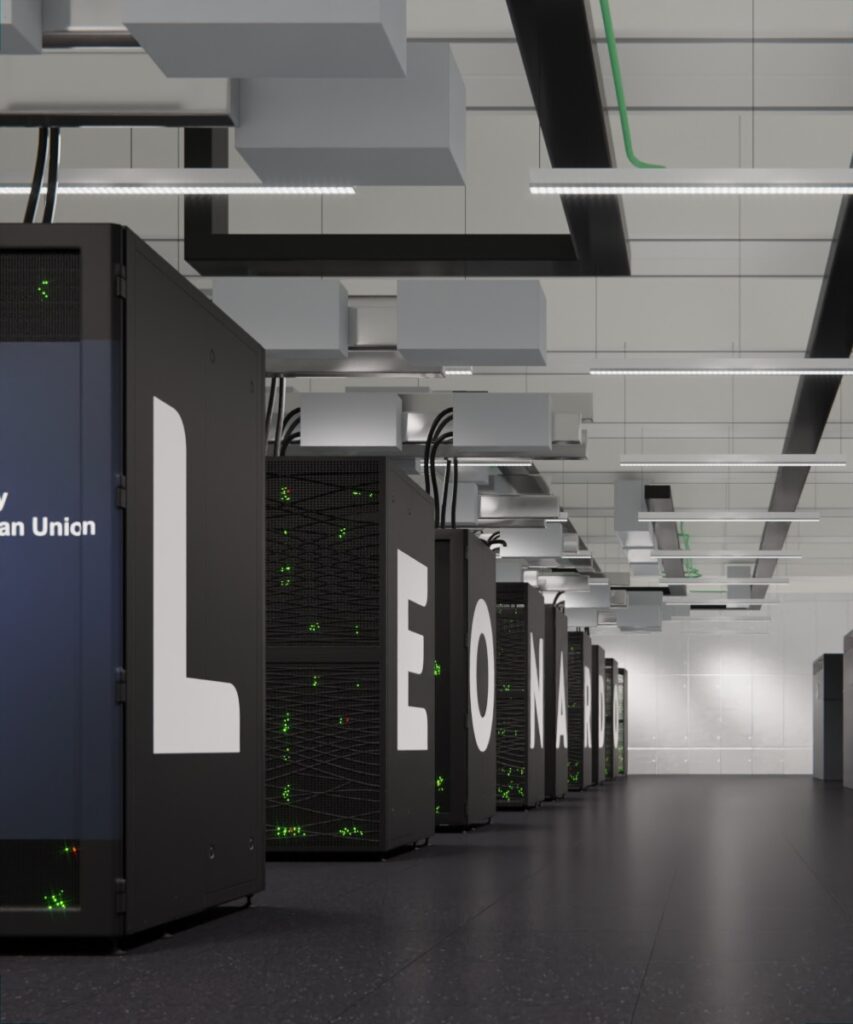
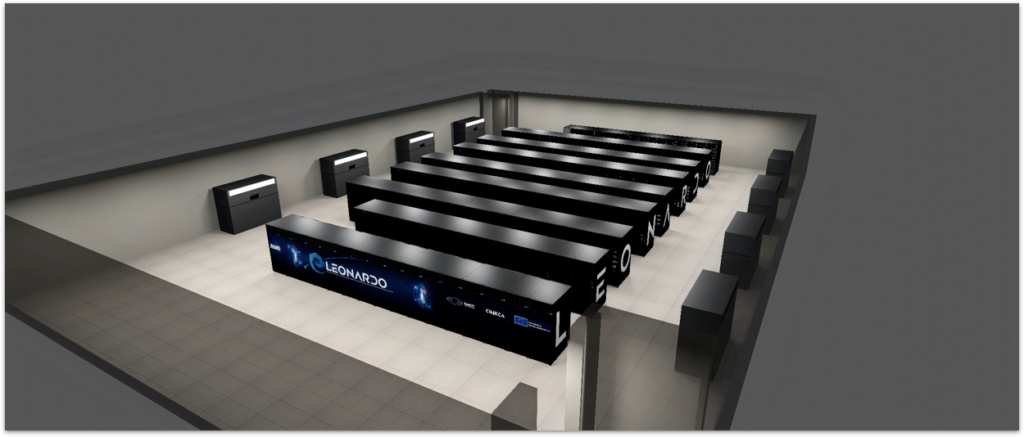
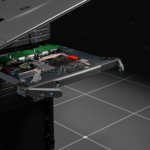
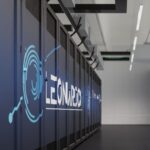
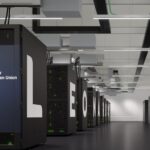
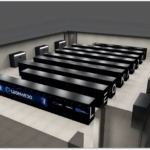
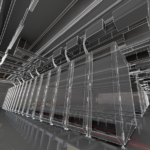
The Visit Lab CINECA teams is working on a 3D model of the machine and of the physical location in which it will be installed. The work has started by acquiring information about the technical layout with rack positioning, cooling system devices and so on.
The aim was to develop a 3D model that will be useful both for management purposes but also for communication purposes.
The model will be very helpful to create the 3D interface for a Leonardo digital twin application.
In particular, the Visit Lab team developed a flexible and adaptable workflow for the construction of a web-based Digital Twin application, featuring an automated modelling phase, adaptability and flexibility with respect to a different industrial physical entity, application accessibility thanks to the web base, and several interaction possibilities thanks to VR/AR virtual model access, a responsive 3D/2D UI and access to virtual model with Virtual Reality devices.
The proposed workflow is focused on some of the main aspects of the implementation of a digital twin, namely:
- Automated modelling
- Connection between physical entity and virtual model
- Connection between virtual model and services
- Connection between virtual model and data
- Interaction between virtual model and users
The implementation and design, already conceived for supercomputing data centres, are highly portable and adaptable for other fields, featuring a simple reusability of the developed framework that serves as the back-end.
At the moment, the infrastructure has two main components focused on the data and its visualization:
the first one is the data lake produced by the Exascale Monitoring Infrastructure, i.e. ExaMon, implemented by the University of Bologna within the European project IoTwins, together with a data lake ES Cineca collecting information about user and projects usage of the machine.
In particular, ExaMon collects several heterogeneous data, both hardware and software, and exposes several tools to consume the telemetry data such as Python API and data formats for various analytics frameworks.
The second one consists of several web-based applications that offers different types of insights into the data, depending on the end-user.
These web applications are both 2D and 3D and they are based on open-source frameworks such as React, used for building 2D interfaces, Blender and Verge3D used for building 3D interfaces and Grafana, used for metrics visualization and exploration.
The model will be soon available.

